by Guadalupe Bernal (gb438) and Nikitha Sharma (ns756).
ECE 5725 Final Project submitted on Wednesday December 14th 2022
Project Objective
The main objective of this project is to accurately measure the
vibrations of a system and find the resonant
frequency where the vibration of the system peaks.
Secondary objectives include :
- Visualizing the data in a useful way for users.
- Feeding the results to an input shaper and testing to see if the
resonance frequency peak is minimized.
Project Video
Introduction
We built a software and hardware package that users can use to
measure the vibrations of a system. With this information they can then account for these vibrations when setting
their acceleration values.
To demonstrate its functionality, we used a single-axis system
containing a stepper motor that rotates a threaded rod to move a plate back and forth. We 3D-Printed a case to
hold both the Raspberry Pi and the accelerometer, which we attached to the plate using binder clips. We
communicated with the accelerometer to collect the acceleration data from the system as the Raspberry Pi
communicated with the Teensy microcontroller to slowly increase the frequency the plate moved at. This information
was then stored in a file and processed on the Raspberry Pi to compute the frequency response. We generated the
following three plots to show the results of the project. Fig. 1 shows the raw data collected, Fig. 2 shows the
frequency response at 40 Hz, and Fig. 3 shows the recommendation of input shaper selection from the Klipper
library.
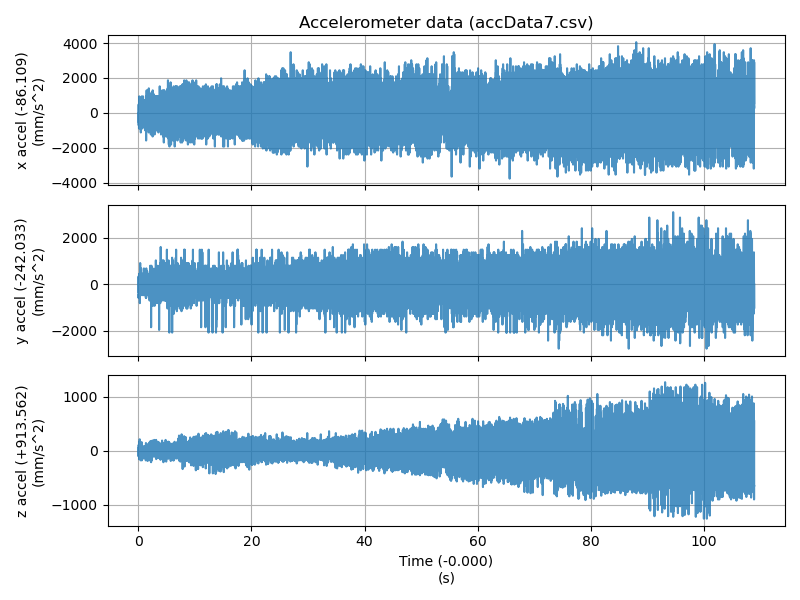
Fig. 1 Raw Accelerometer Data
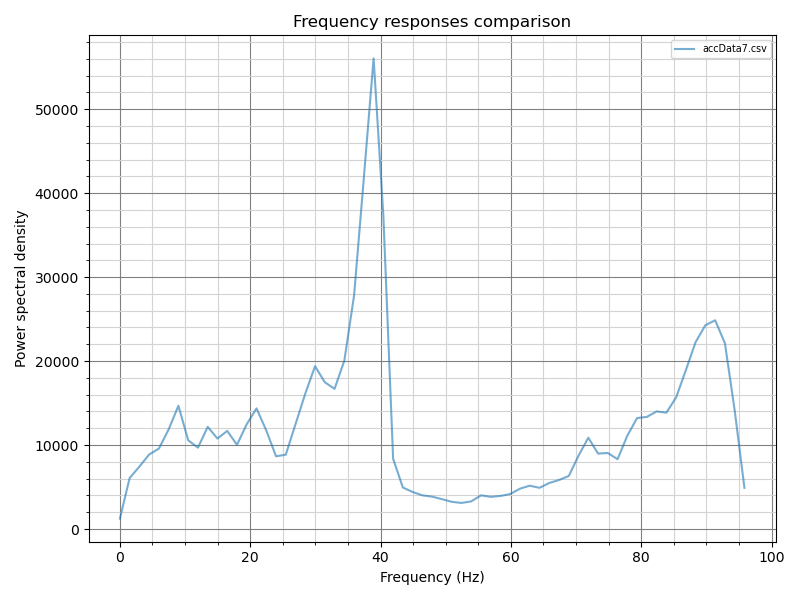
Fig. 2 Frequency Response in the X-axis
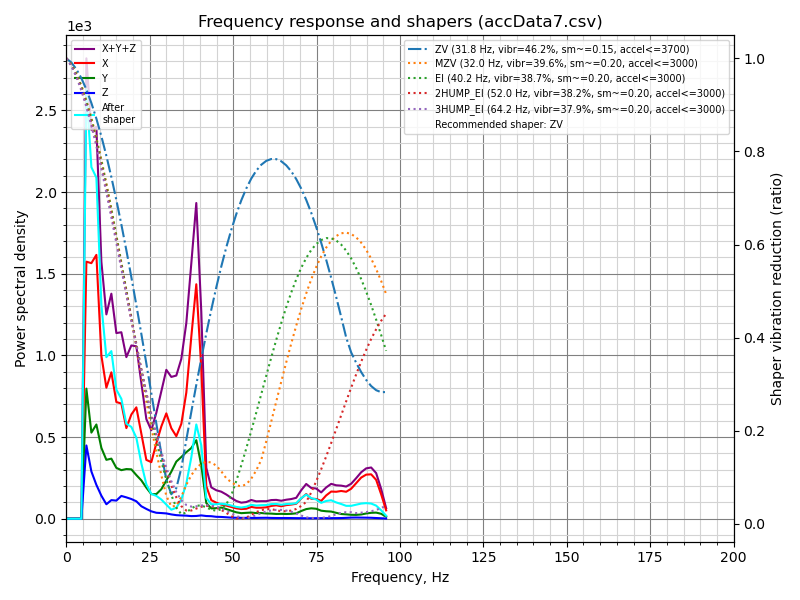
Fig. 3 Klipper Input Shaper Selection
Design and Testing
In defining our project, the hardware we would require would include
the Raspberry Pi, an accelerometer to measure the accelerations, a 3D Printed case to hold both these boards, and
a test system that we could measure the vibrations of. The Raspberry Pi would be connected to the accelerometer
and would also connect to a Teensy Microcontroller which controlled a stepper motor in our test system.
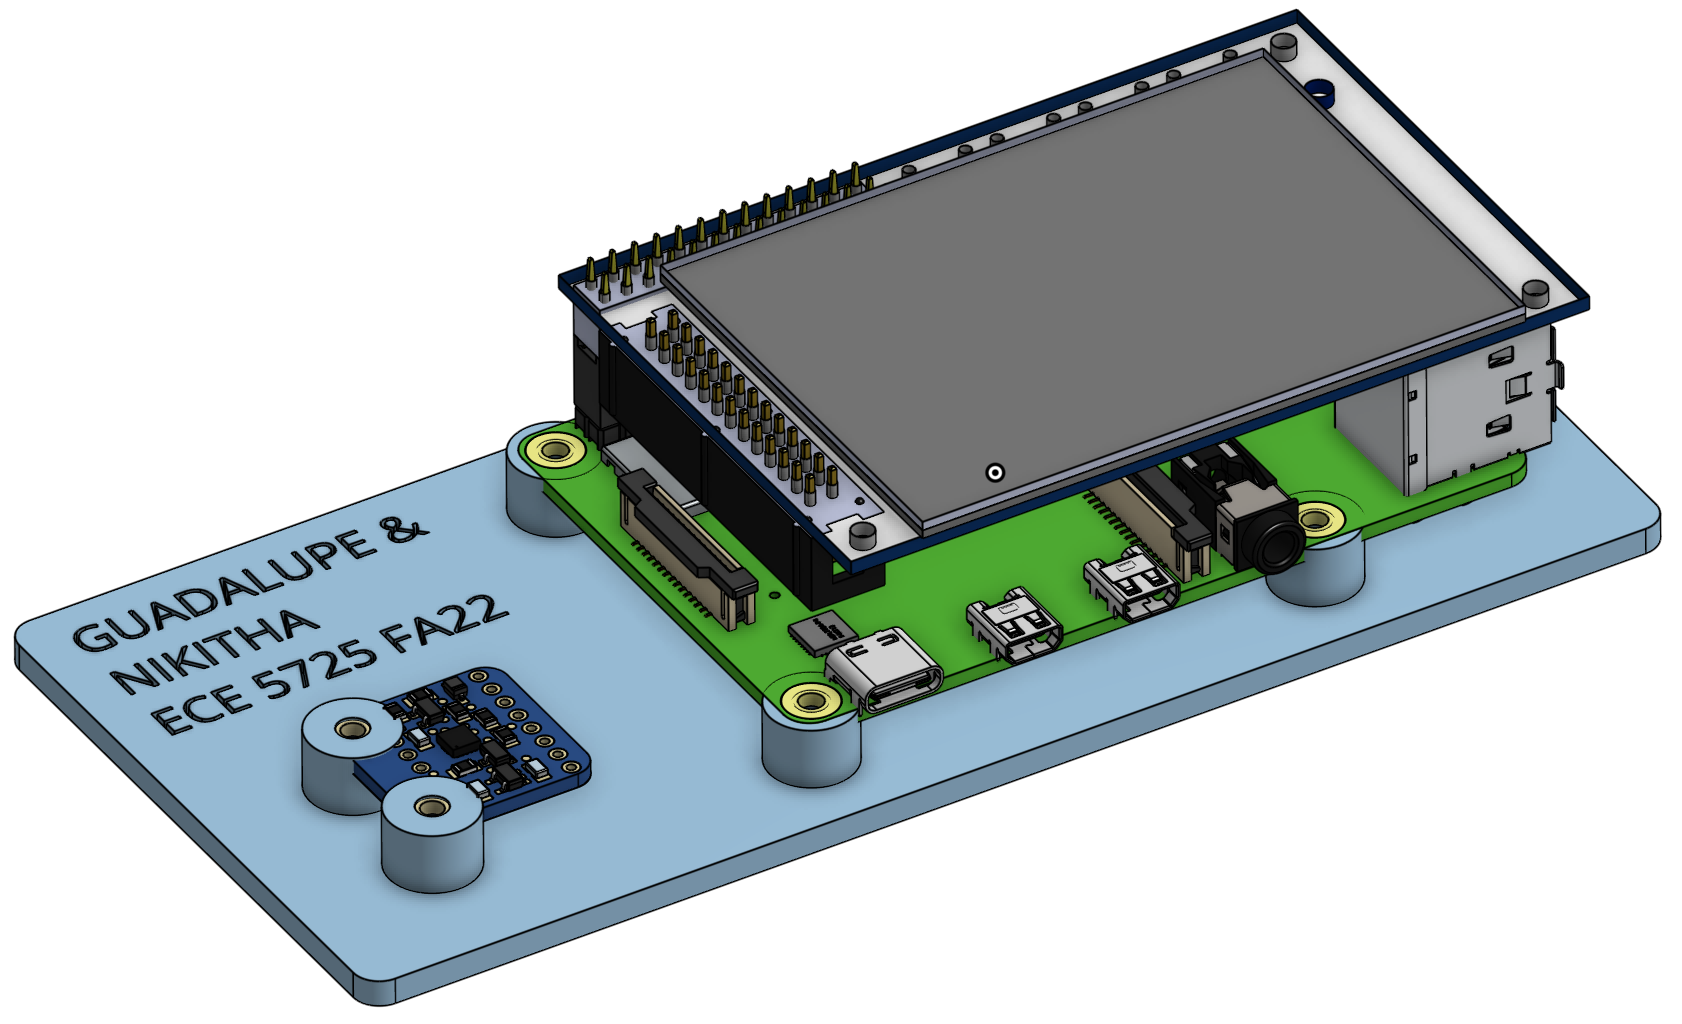
We designed the case in OnShape and it is linked below. Fig. 4 shows
the final design. We went through two iterations of this board because our first design was too thin and the holes
too small so it cracked when we tried to attach the Raspberry Pi and accelerometer. We brainstormed a variety of
ways to attach the case to the test system, but with advise from TA’s and the professor, finally decided that the
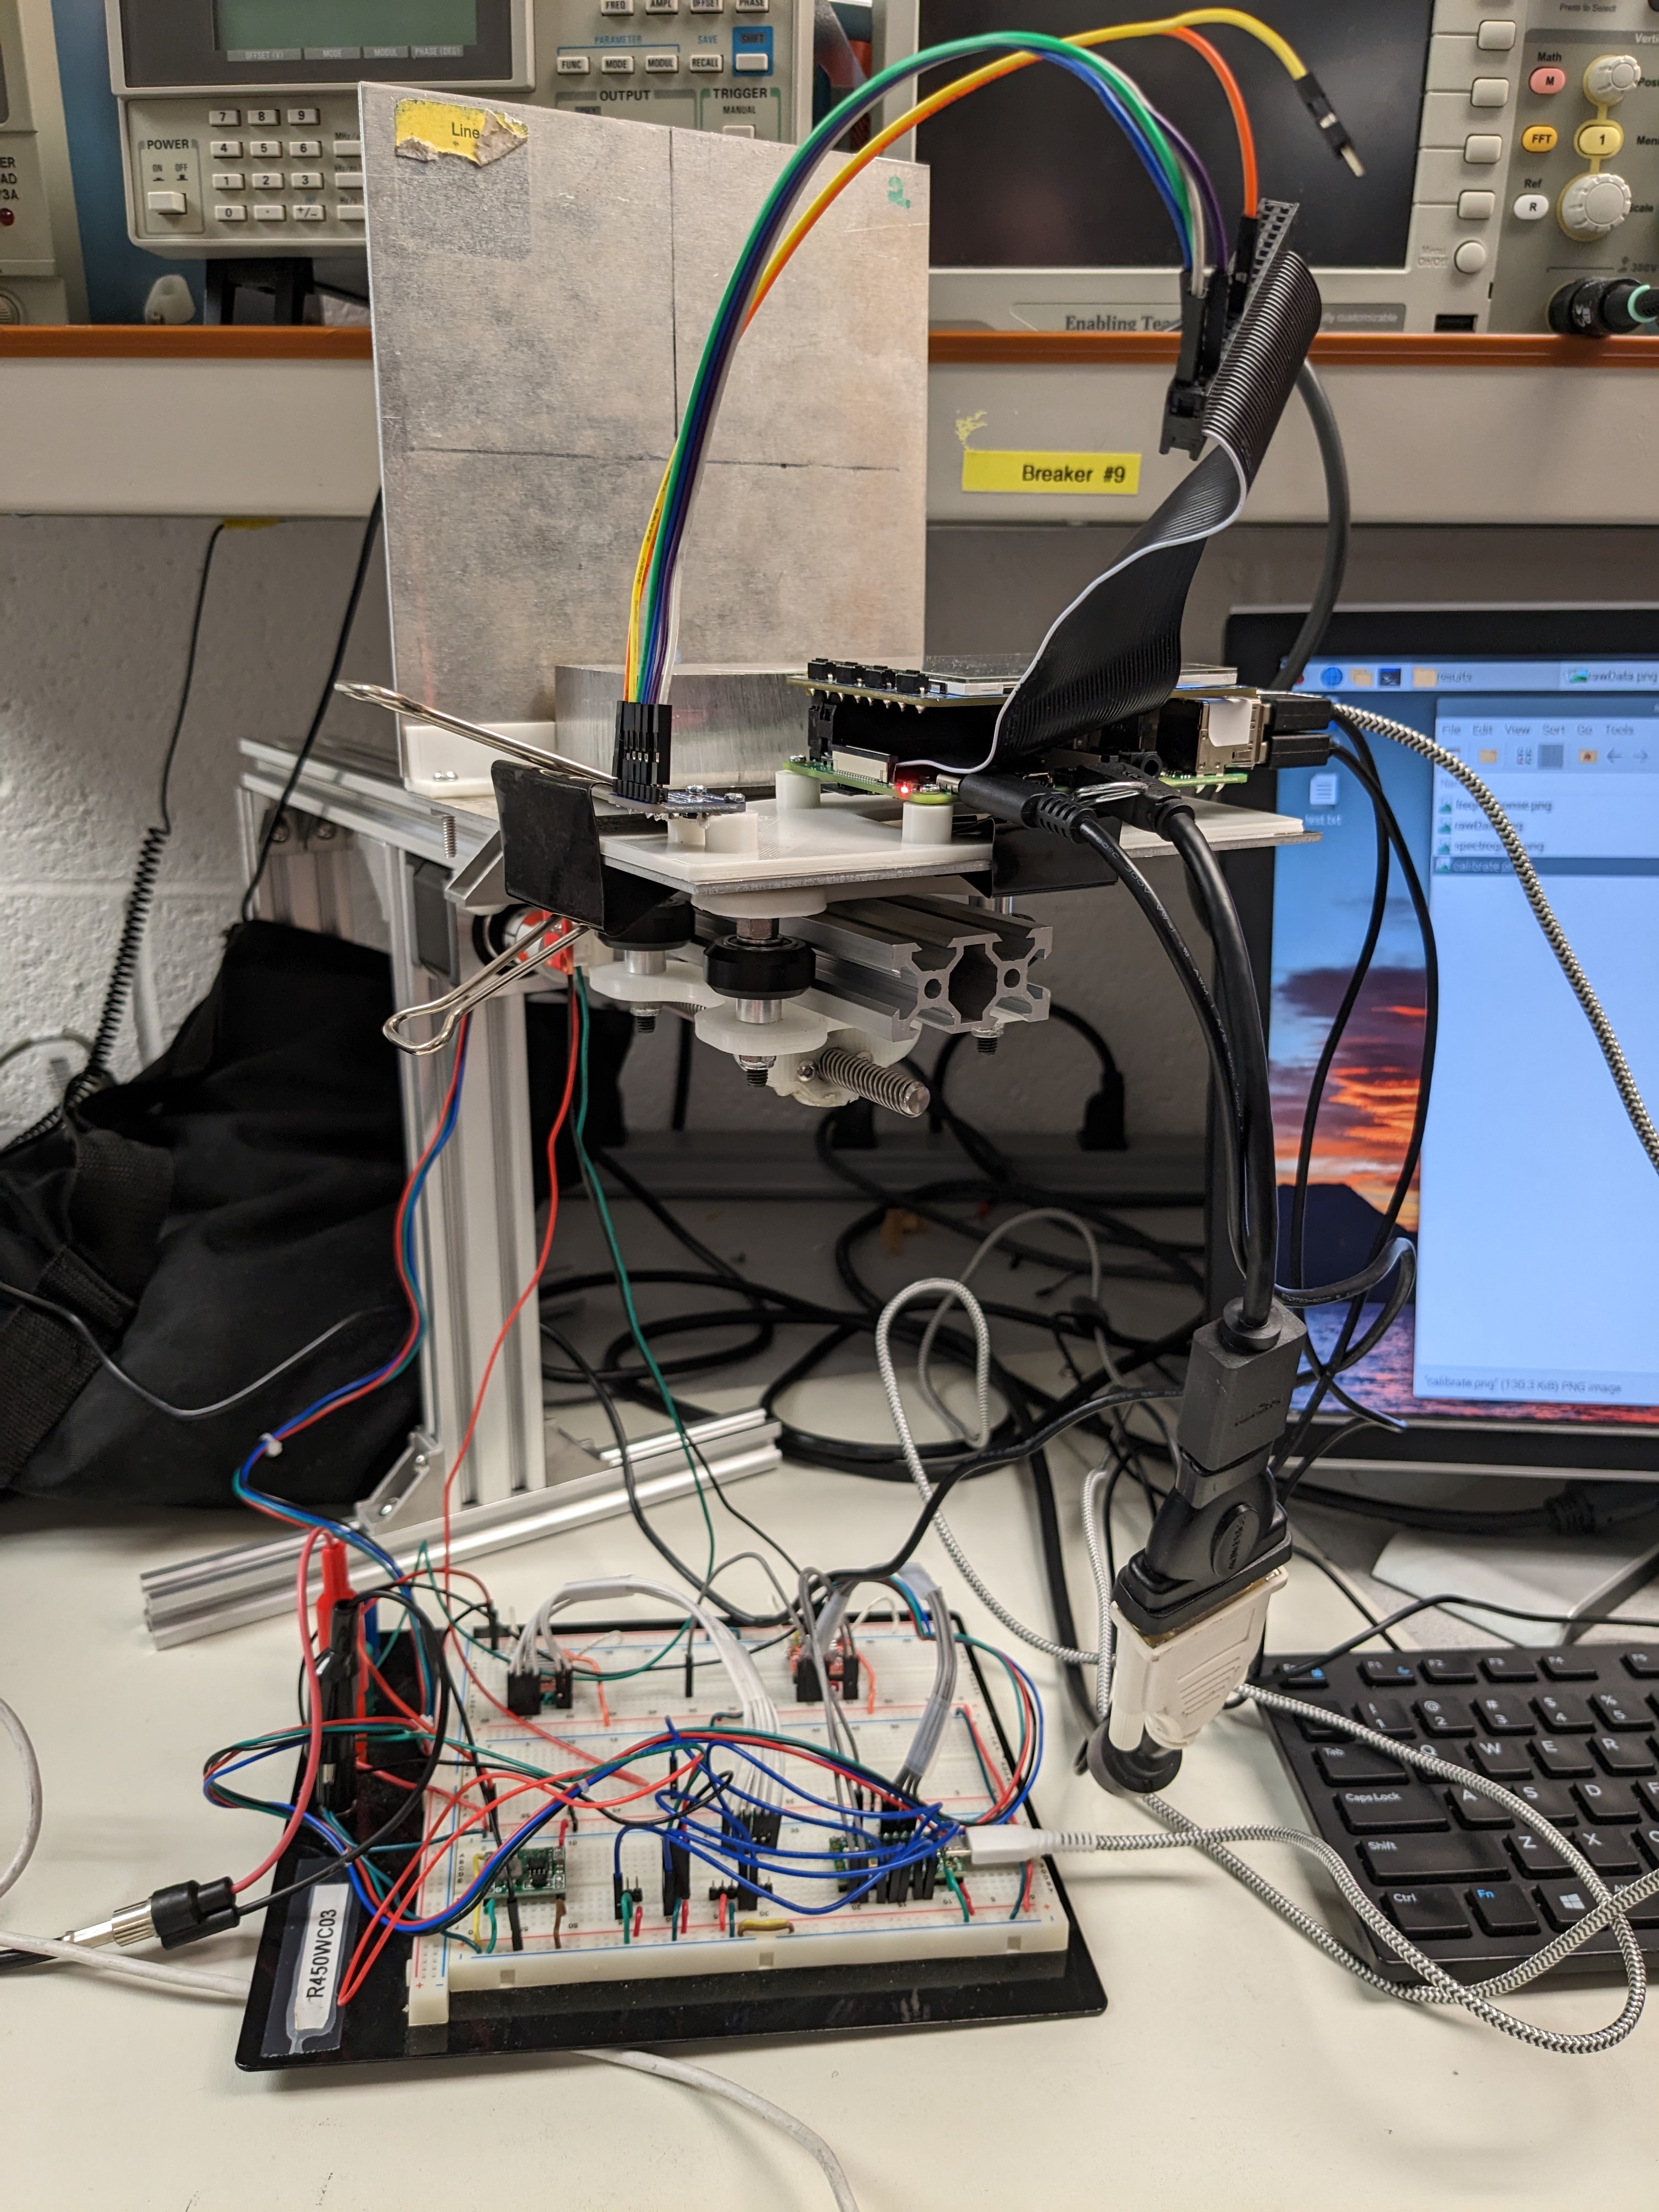
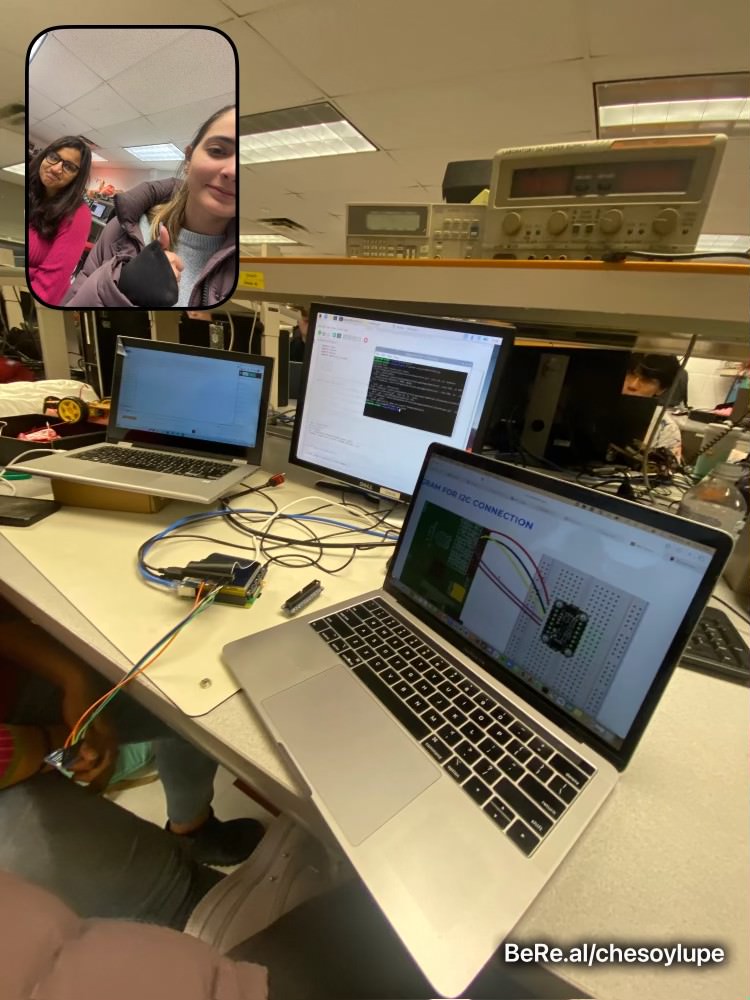
easiest and quickest way would be to use binder clips. Fig. 5 below shows the final setup with the 3D printed
board, accelerometer, Raspberry Pi, and testbed all connected to power and the monitor.
We took an incremental approach to designing and testing the hardware
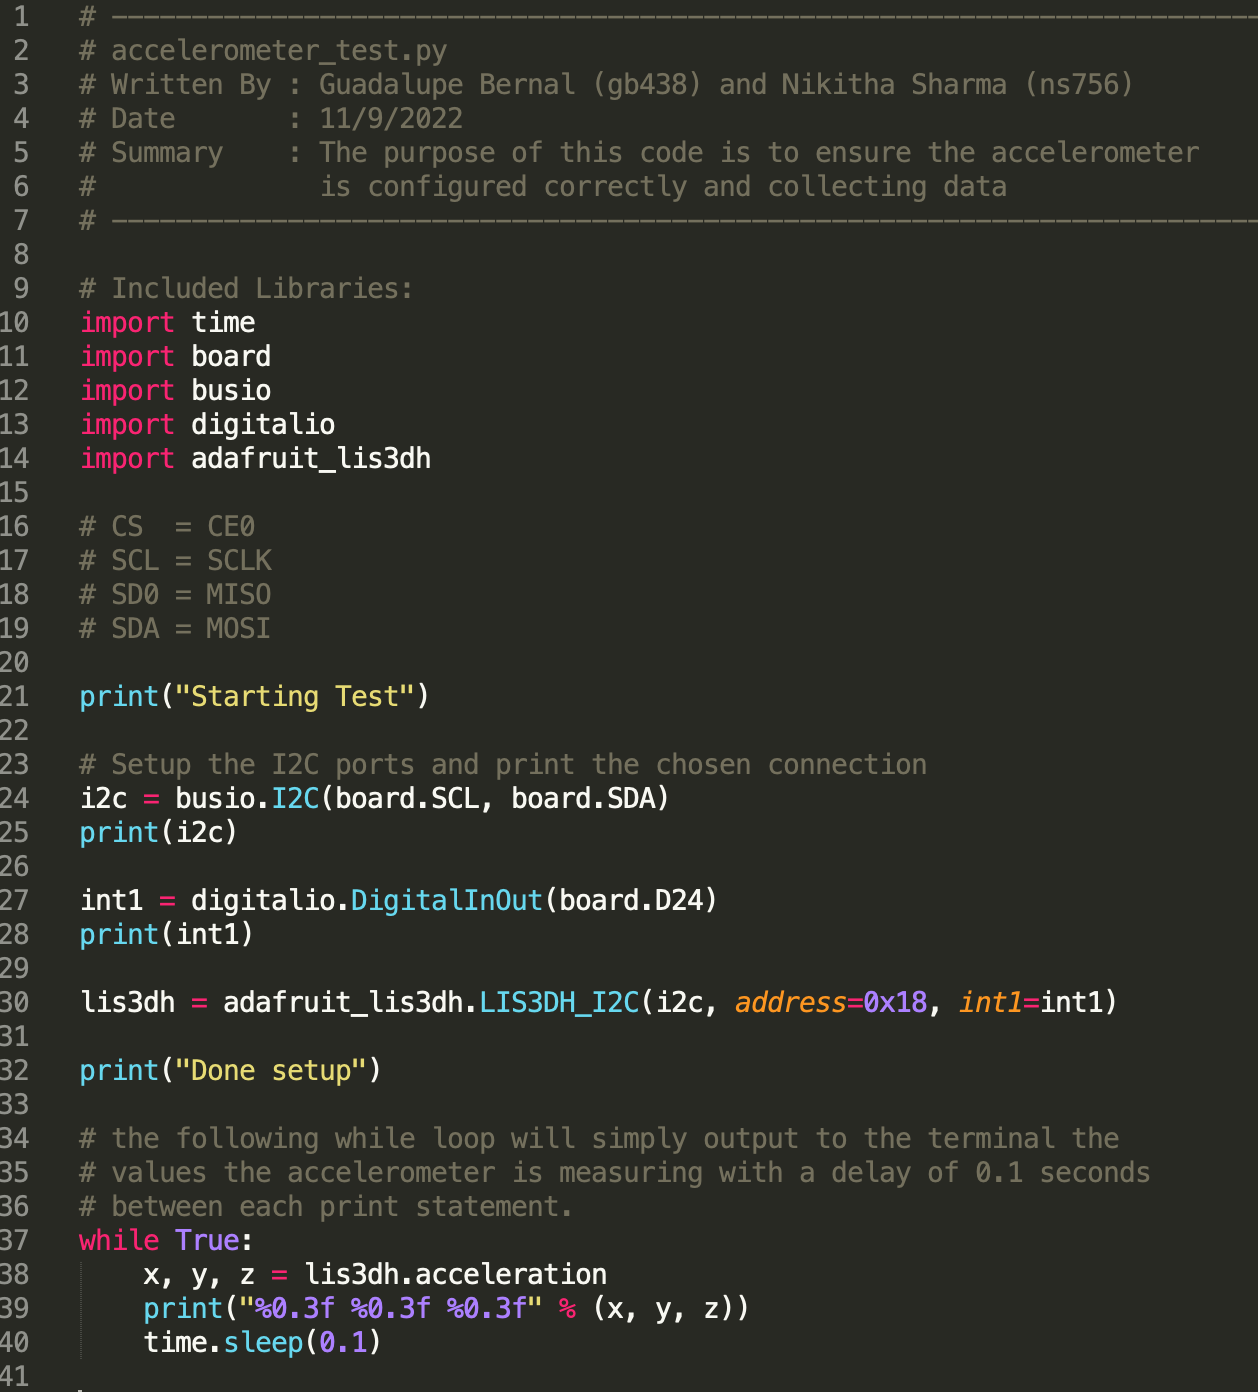
system. First, we tested the accelerometer with the Raspberry Pi to ensure that this was working properly. We did
this using “Code #1 : Accelerometer Test Code” in the code appendix. This program simply initializes the i2C
connection between the accelerometer and the Raspberry Pi and outputs to the terminal the values it is measuring.
We faced minor issues with selecting the exact library for our accelerometer but this was a quickly fixed mistake.
We also struggled establishing the SPI connection but once we reviewed how SPI communication works and which pins
and values needed to be initialized, the process went much more smoothly.
Once the accelerometer was collecting consistent data, we moved on to
controlling the Stepper Motor System and made sure that we were able to change the frequency of the motor based on
the input sent to the Teensy microcontroller from the Raspberry Pi. The main issues we faced in this part of the
project included the communication between the Raspberry Pi and the Teensy controller. This part of the project
proved to be a challenging one and we had to spend several hours debugging this to ensure effective communication
as the results completely relied on this communication. During this stage, we realized that our initial idea of
having the user manually input the frequency to the Teensy controller was a bad idea because to obtain meaningful
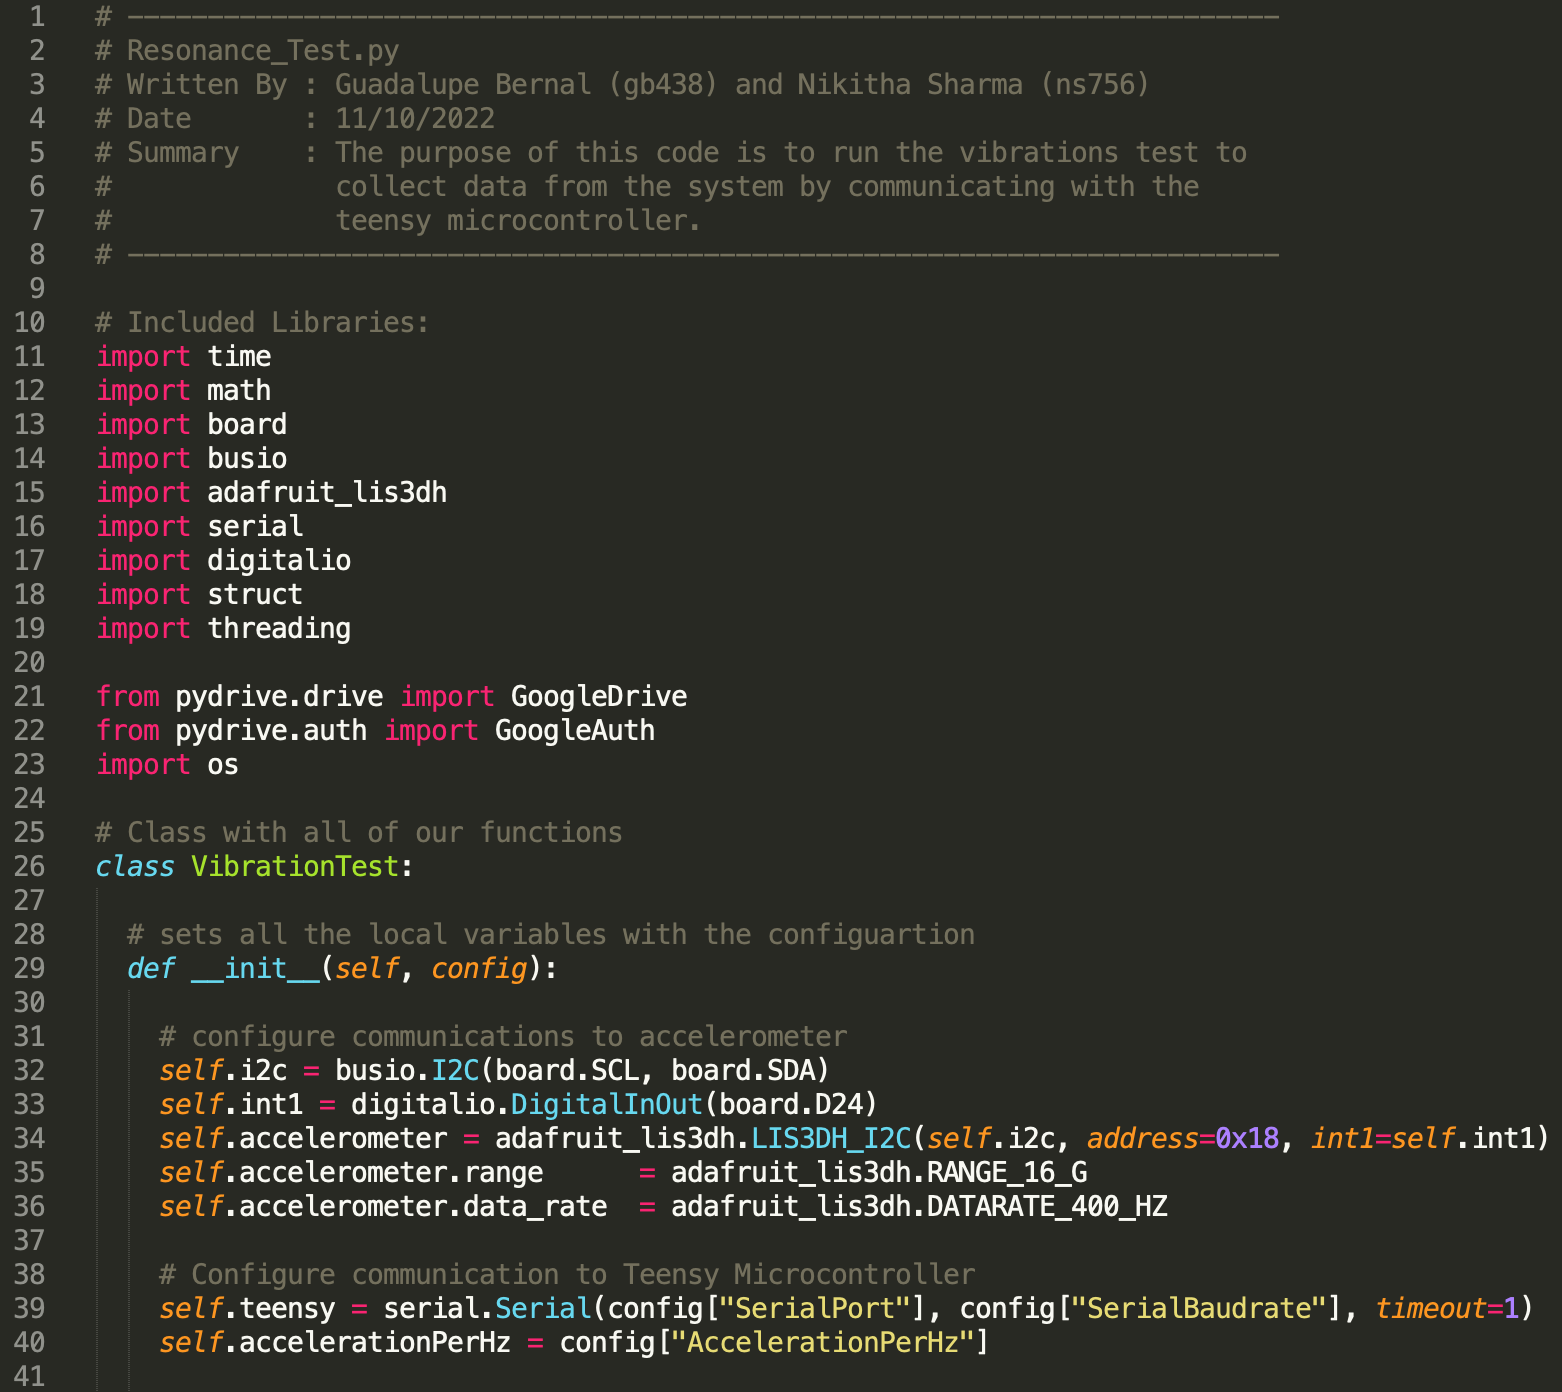
results, the system had to be tested with a huge range of frequencies. We used serial communication between the
two by connecting them via a USB cable. At this point, we made a change in the system and made the Raspberry Pi
control the frequencies by iterating through a specified range of frequencies. Another thing we attempted was
sending a string as our information package but we quickly realized that was too large and so we ended up spending
a lot of time figuring out how to format a python byte package of the correct size to send a single value to the
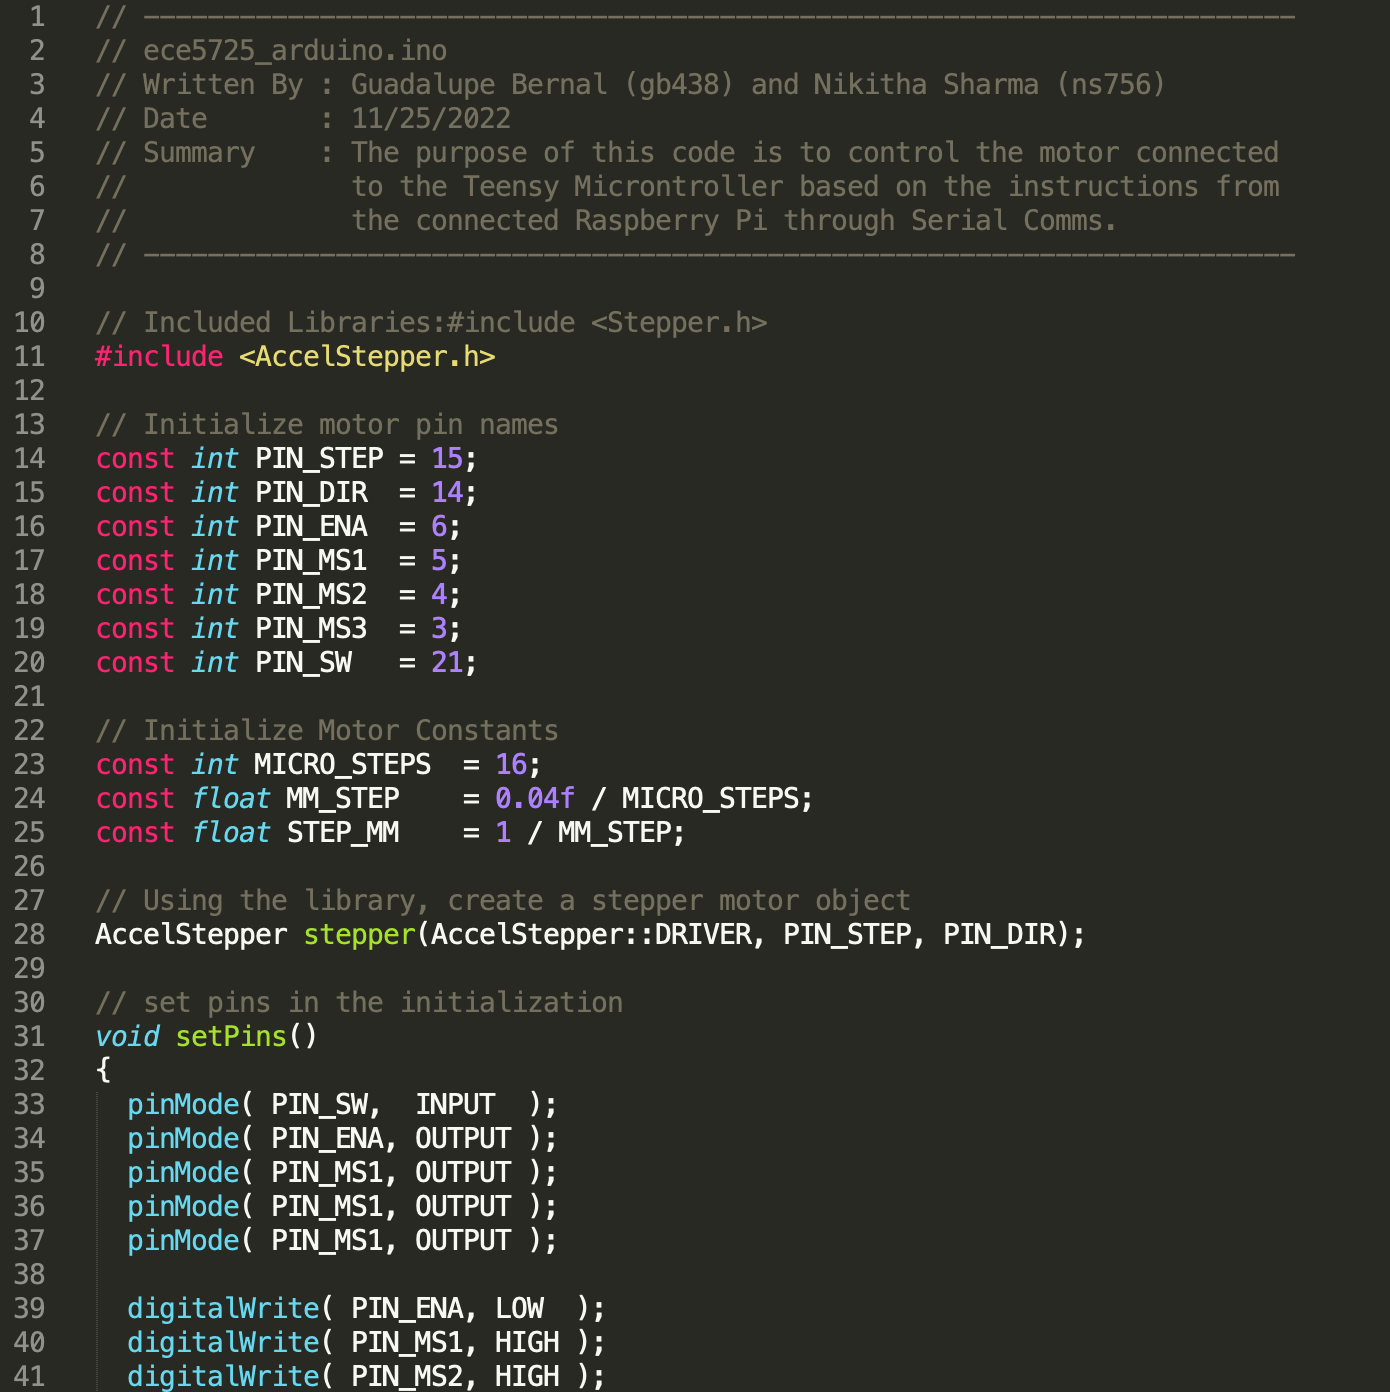
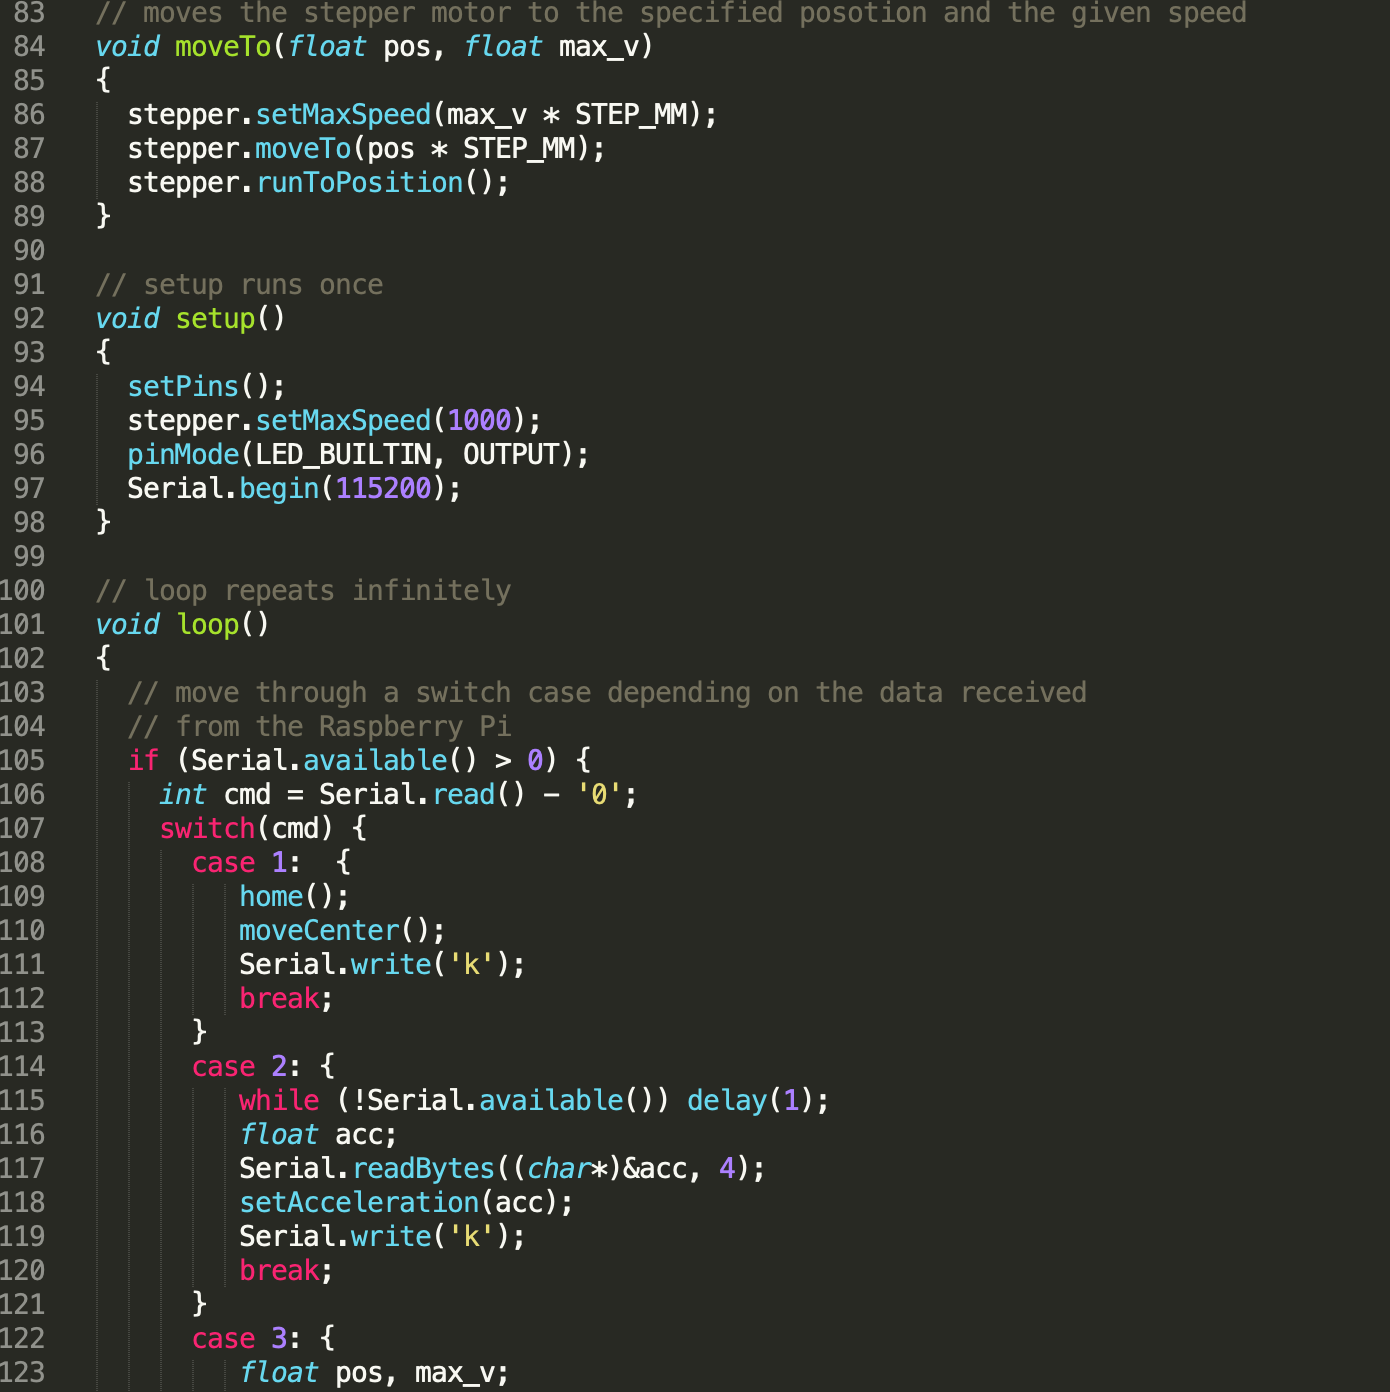
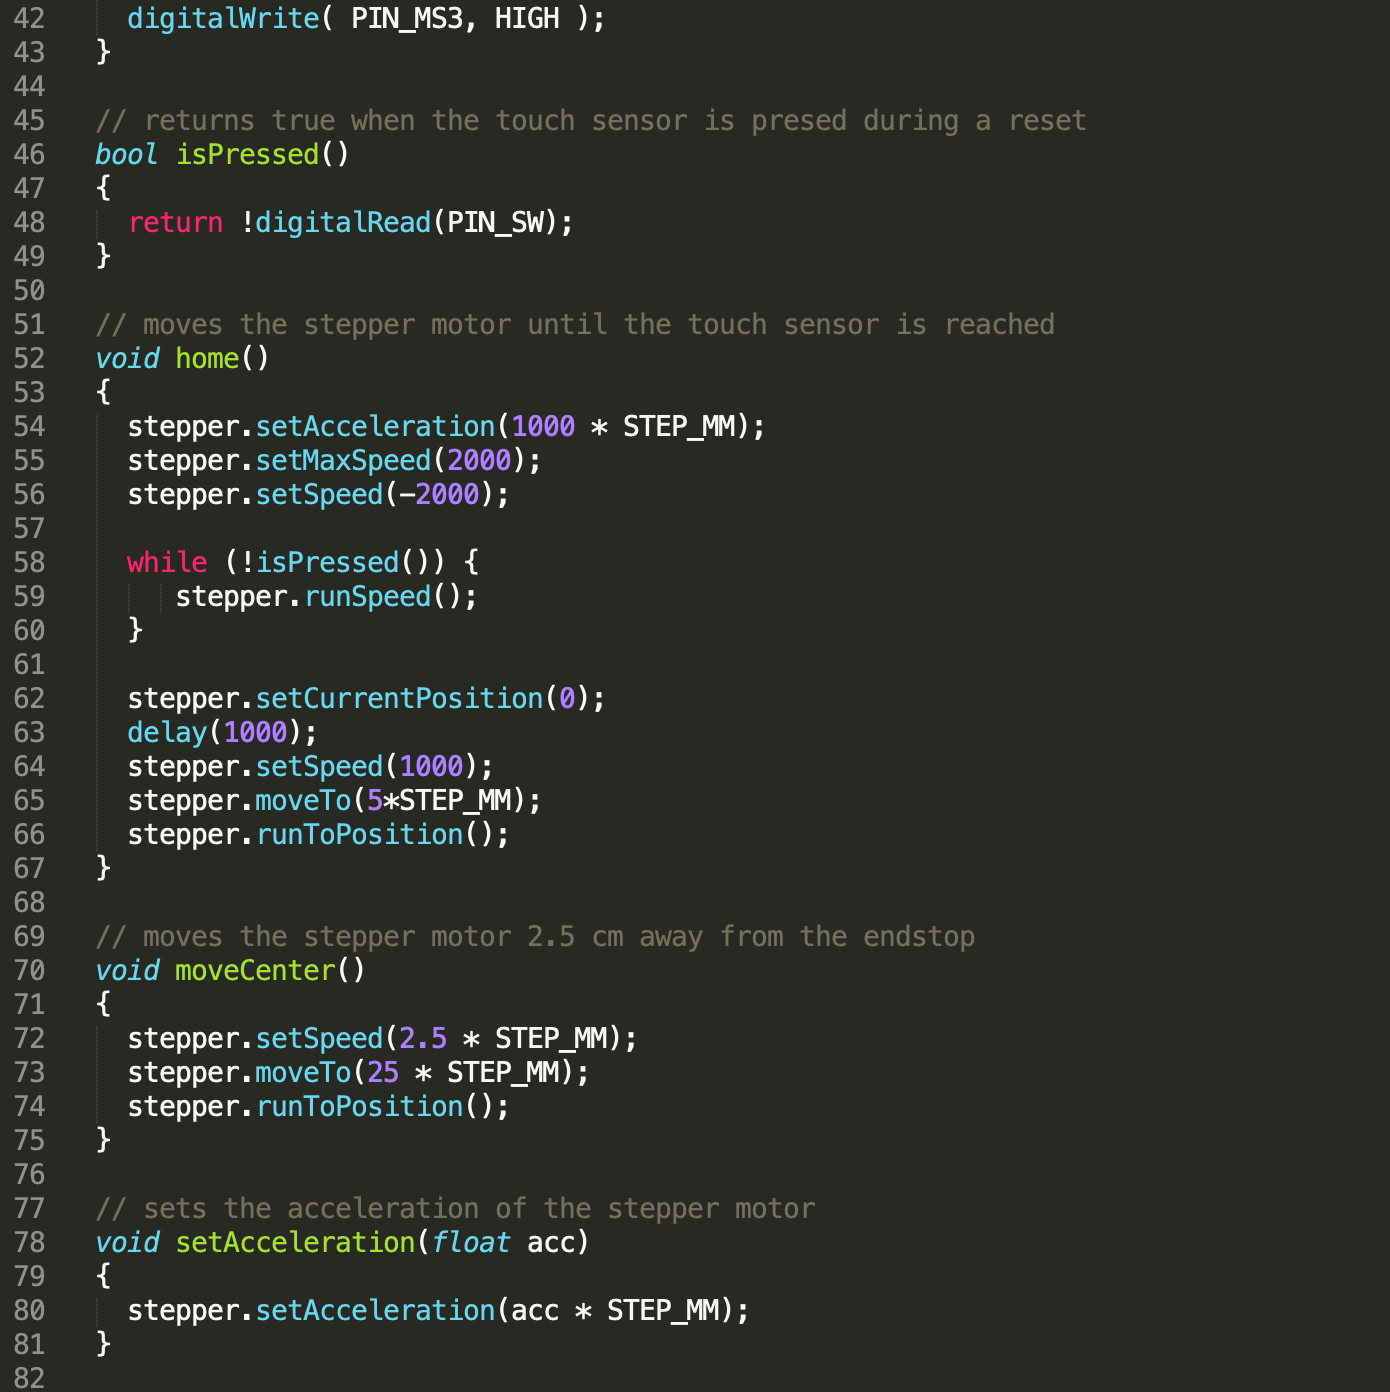
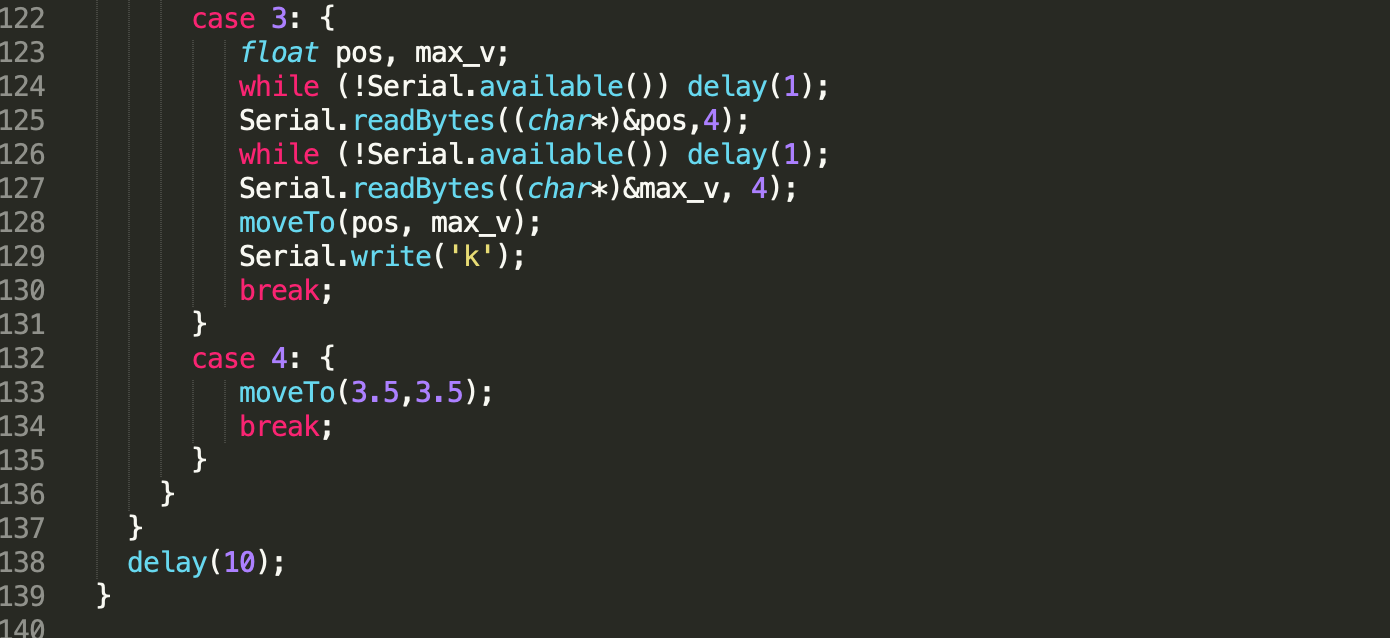
Teensy. The code to receive this information was much simpler as it was written in C and can be seen in “Code #3 :
Arduino Motor Control Code”.
Once we could successfully send values back and forth, we thought we
had solved all our issues, but then we observed some interesting behavior. The Raspberry Pi would send the values
to the Teensy controller and sometimes there would be a buildup with all of the values being sent and the Teensy
controller would not be able to process the values sent to it, since each of the values corresponded to a task
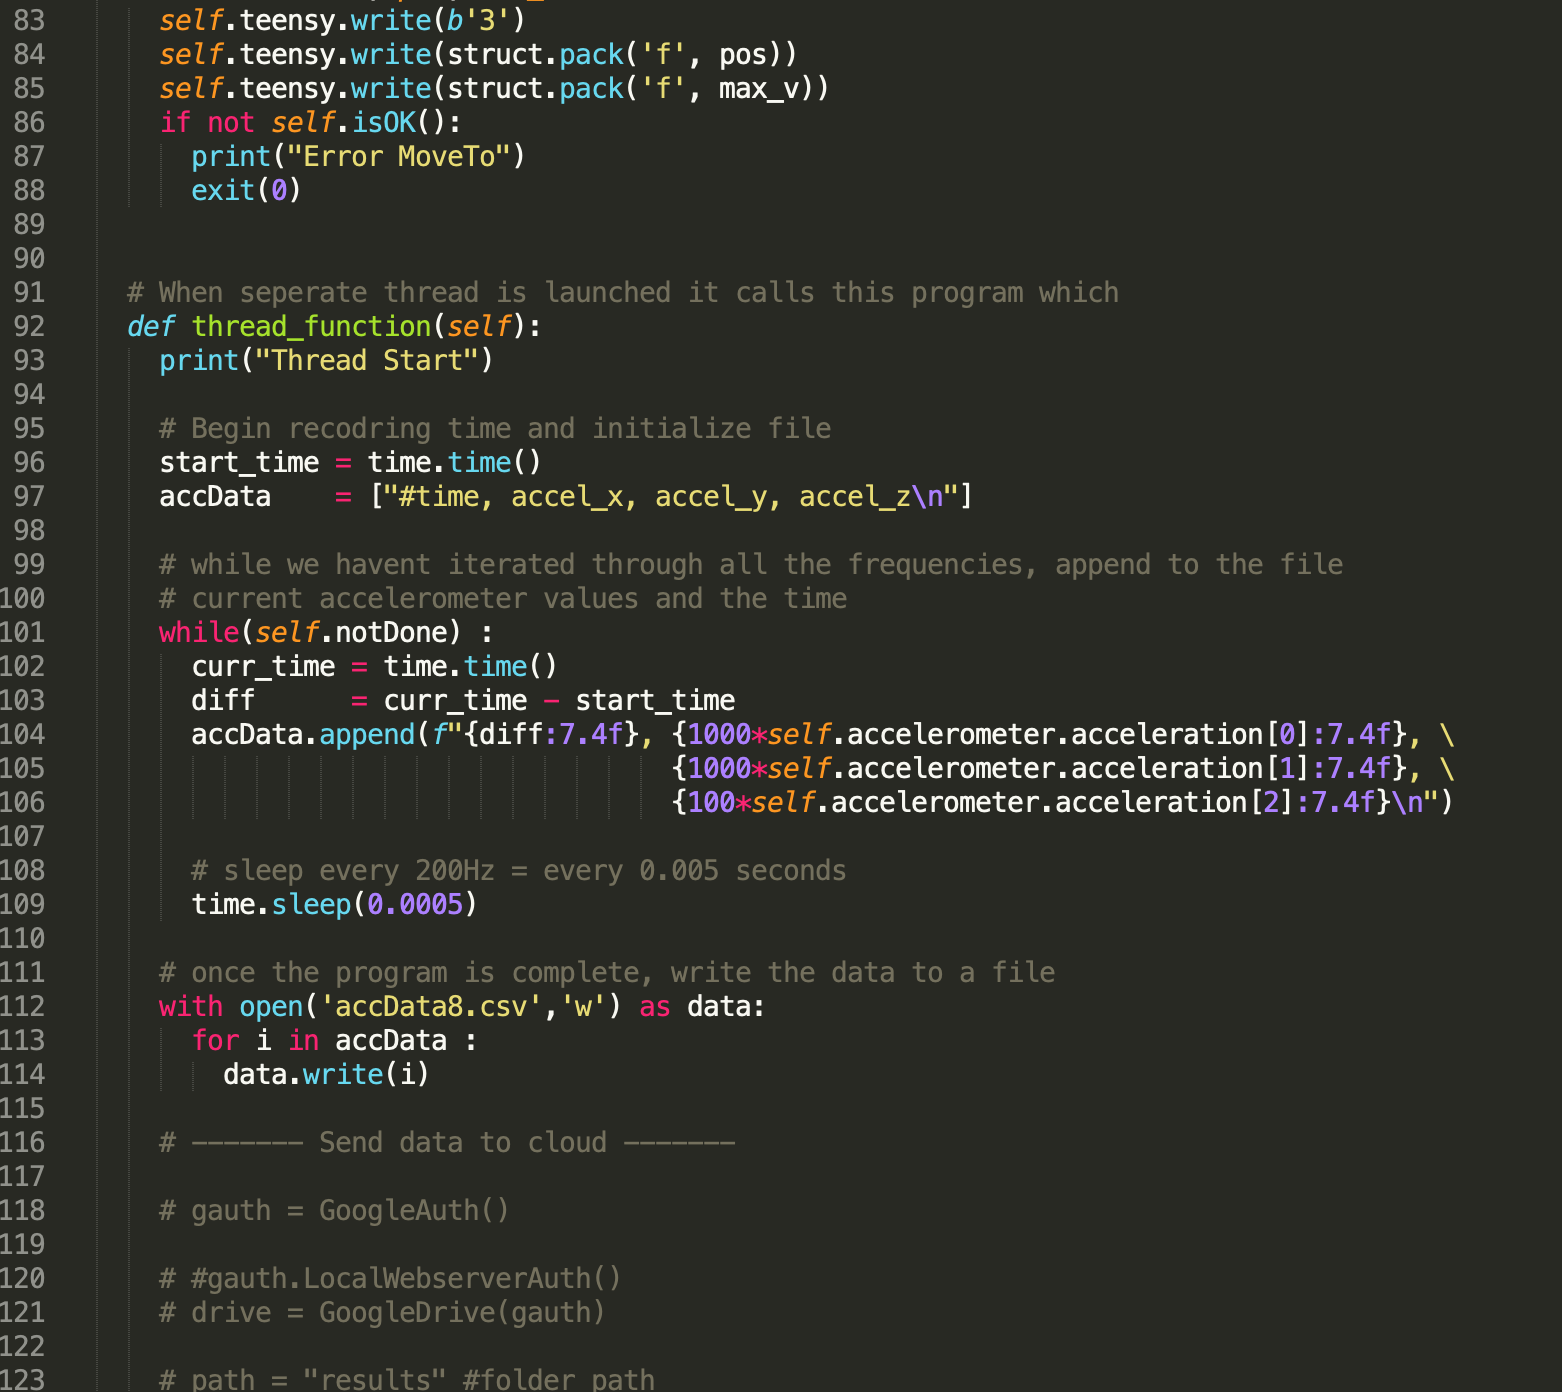
involving moving the motors, which takes time. After a lot of brainstorming and trials, we devised a handshake
system in which the Raspberry Pi would wait for an acknowledgement from Teensy before sending the next frequency
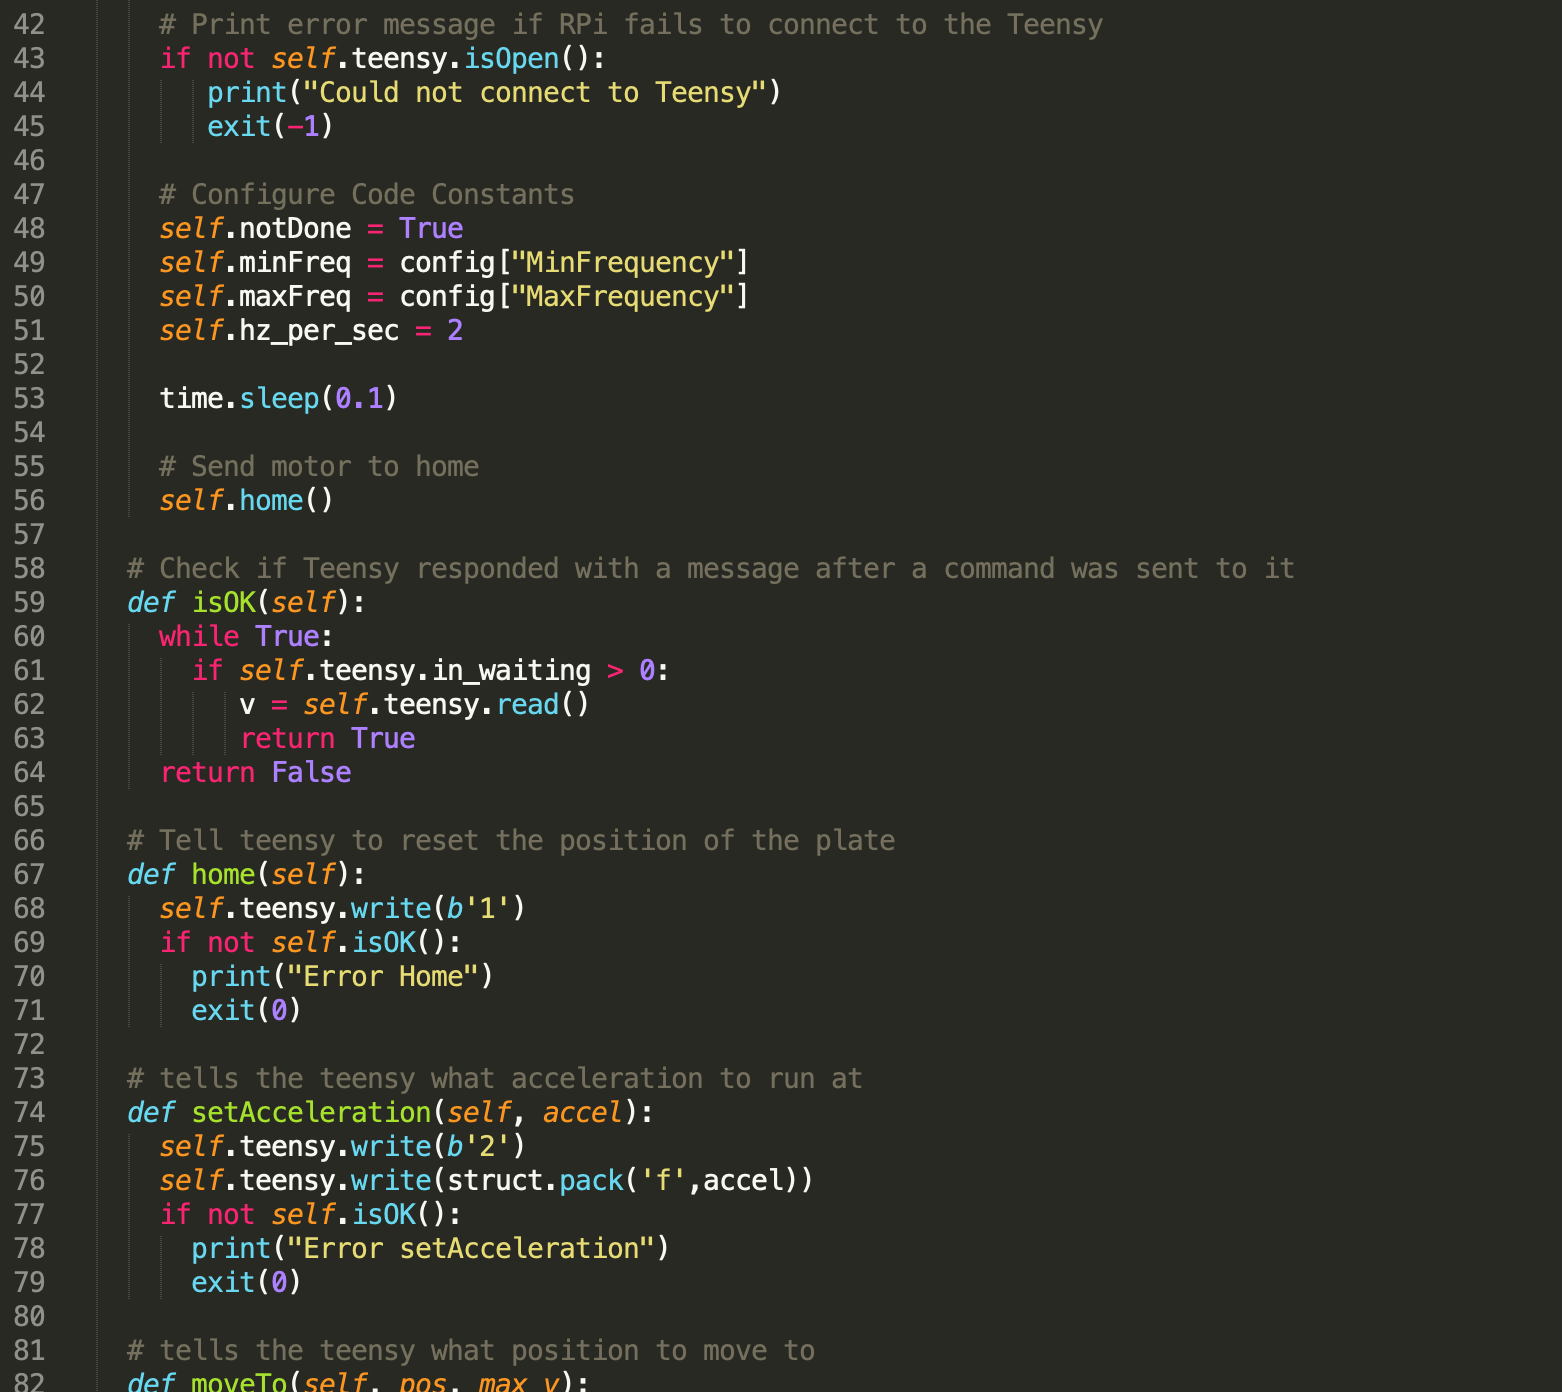
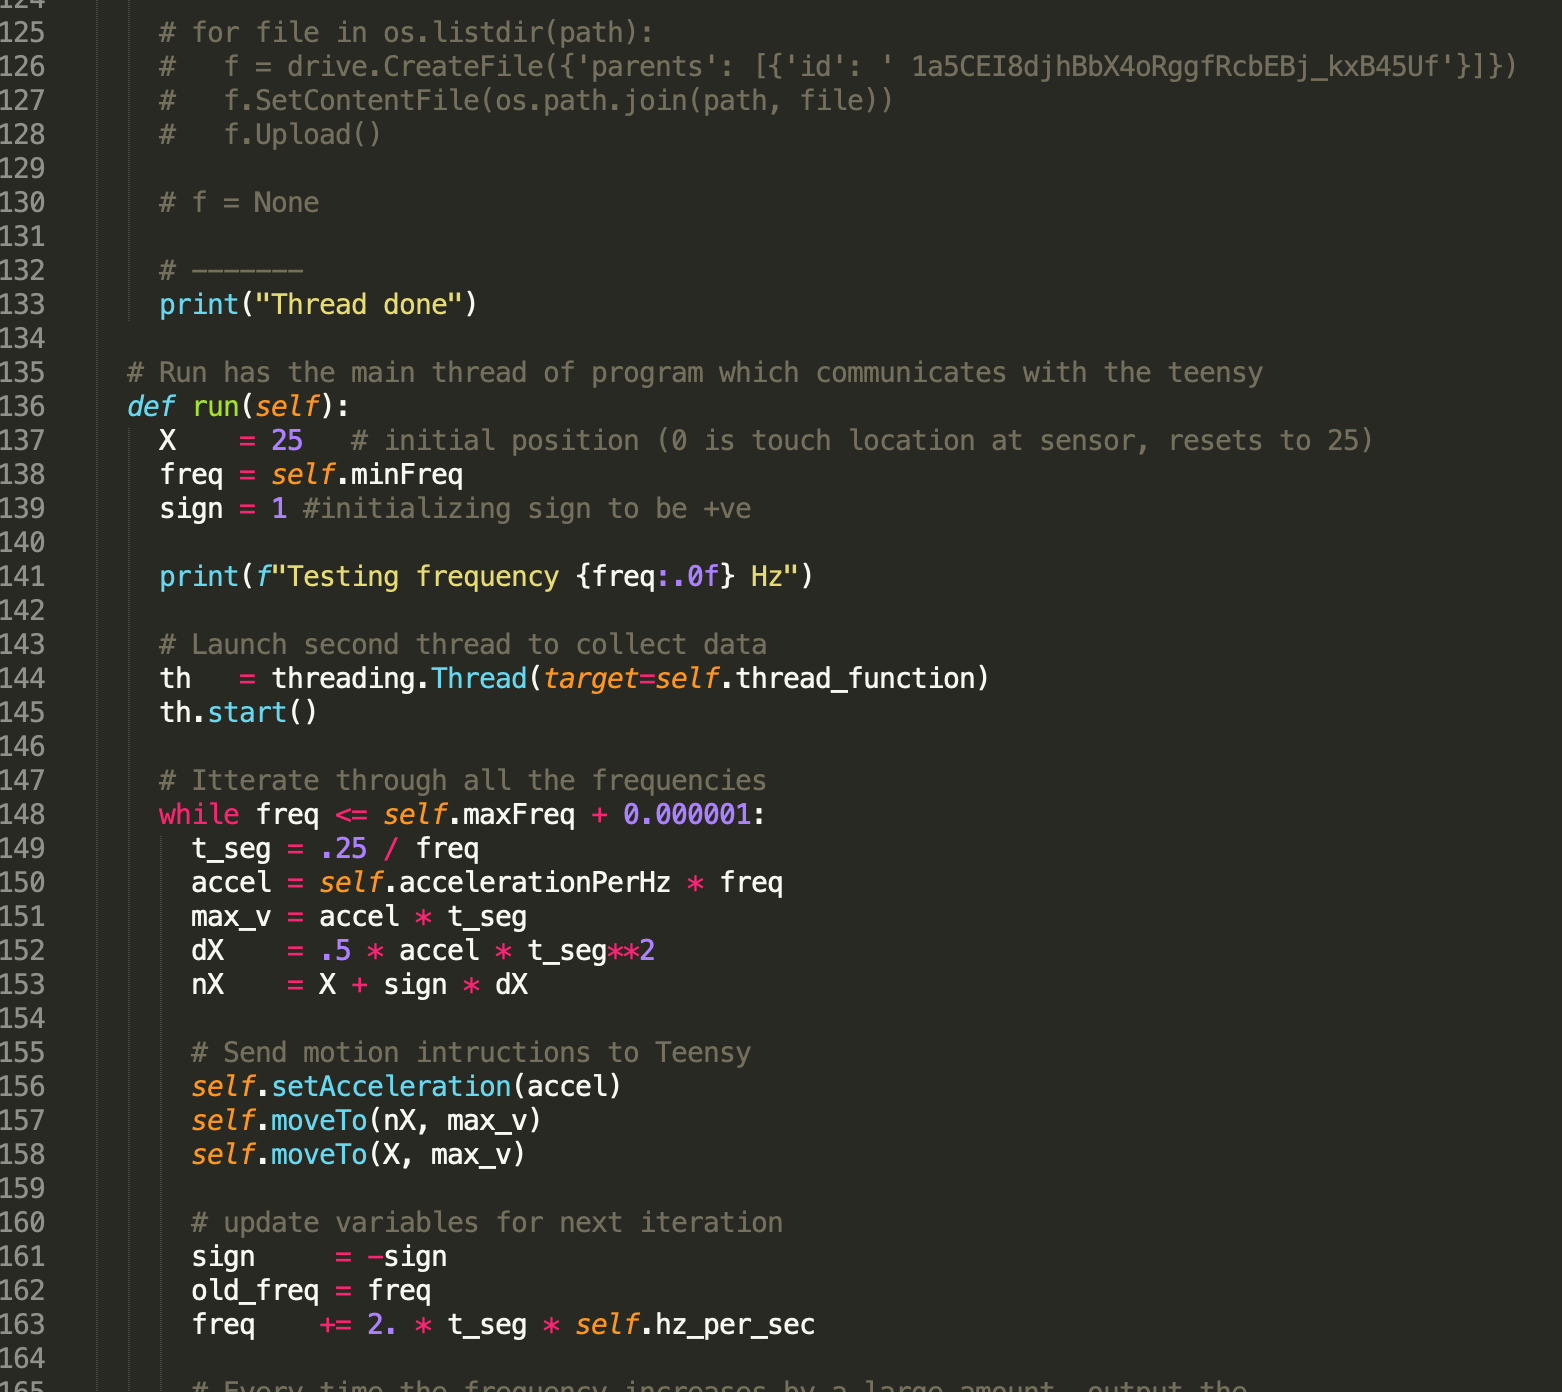
command. This was the main part of our “Code #2 : Resonance Tester Code”.
After the communications were finally debugged and the output results
of the accelerometer data looked as expected to us, we started working on analyzing this data. For this, we
started off by plotting the raw data from the accelerometer. We saw a significant change in the acceleration over
time across the X axis because this is the axis in which the motor was moving. There was some acceleration in the
Y direction which we believe is noise and the in the Z direction also we saw some acceleration which is because of
the slant in the position of the test system meant that as the metal plate moved back and forth in the X axis, it
would also move up and down at that angle in Z. This data is shown in Fig. 1.
Once we had this raw data, we began processing this data. We were
able to generate the frequency response of the system which was the power spectral density vs frequency graph.
This is shown in Fig. 2. From this graph, we were able to see the peaks which showed us the resonant frequency of
the system. For this sample system setup, there was a peak at approximately 40Hz, which means that at this
frequency the vibration of the system is drastically increased when compared to every other frequency and needs to
be reduced for better functioning. We also used Klipper, the software library that is currently being used by 3D
printer hobbyist to increase how fast their printers can print by accounting for the resonance frequencies in
their printers, to theorize how different input shapers would change the frequency response of the system. Using
Klipper, we were able to plot the graphs shown including Fig. 3 which shows that the recommended input shaper for
our system is Z2.
Results
We were able to find the resonant frequency of our test system and we
were also able to output the data into graphs that helped us better understand the results. As shown in the video,
once we run our system, the Raspberry Pi iterates through a series of different frequencies and communicates with
the Teensy Controller to run the motor at said frequency. Concurrently, the accelerometer attached to the
Raspberry Pi records the acceleration data and once all the frequencies have been iterated through, outputs it
into a single csv file. We then use this csv file to create plots that help us visualize and understand the
frequency response of the system. Out of these, the power spectral density graph, Fig. 2 is the one that shows us
the resonant frequency of the system. We also feed the data to Klipper which generates the plots and also suggests
the shaper that would achieve the best results for this data.
Conclusion
We were able to successfully measure the frequency response of our
sample system. This satisfied our primary objective of the project. We wanted to add a graphical user interface
and also feed the response back to the system to improve it but we weren't able to complete these tasks. We were
able to code pushing the output files to the cloud which could be expanded on in future work to allow for remote
debugging and offline post-processing of the data.
Future Work
There are many areas in which this project can be expanded and
improved. On the hardware side of the project, we would definitely want to redesign the case to split it in two.
With this approach the accelerometer could be attached to the system, while the Raspberry Pi and its connecting
wires to power, mouse, keyboard, and monitor, are connected separately and don’t interfere with the system's
motion. We were able to measure the frequency response in spite of this mistake in our design, but the frequency
might shift without this additional weight. On the software side of the project we would want to expand into our
secondary objective of feeding the frequency response data into an input shaper, using that controller to control
the motors, and then running the main program again to see if we succeeded in minimizing the resonance frequency.
Budget
Almost all of our parts came exclusively from the ECE 5725 Lab.
Raspberry Pi 4 - Free - Provided in lab
Accelerometer (ADXL345) - Free - Provided in lab
Screws (6) and Nuts (6) - Free - Provided in lab
Jumper Wires - Free - Provided in lab
Binder Clips - Free - Provided in lab
3D Printed Plastic Case to hold the Accelerometer and Raspberry Pi - Free - From SSDS Lab
Conker, C., Yavuz, H., & Bilgic, H. H. (2016). A review of command
shaping techniques for elimination of residual vibrations in flexible-joint manipulators. Journal of
Vibroengineering, 18(5), 2947–2958. https://doi.org/10.21595/jve.2016.16725
Here we also wanted to thank Professor Mason Peck and Katherine Wilson.
The hardware Motor Setup with Teensy was obtained from Professor Peck’s laboratory, the Space Systems Design Studio
(SSDS) and was developed under the supervision of Katherine Wilson.
Code Appendix
Code #1 : Accelerometer Test Code
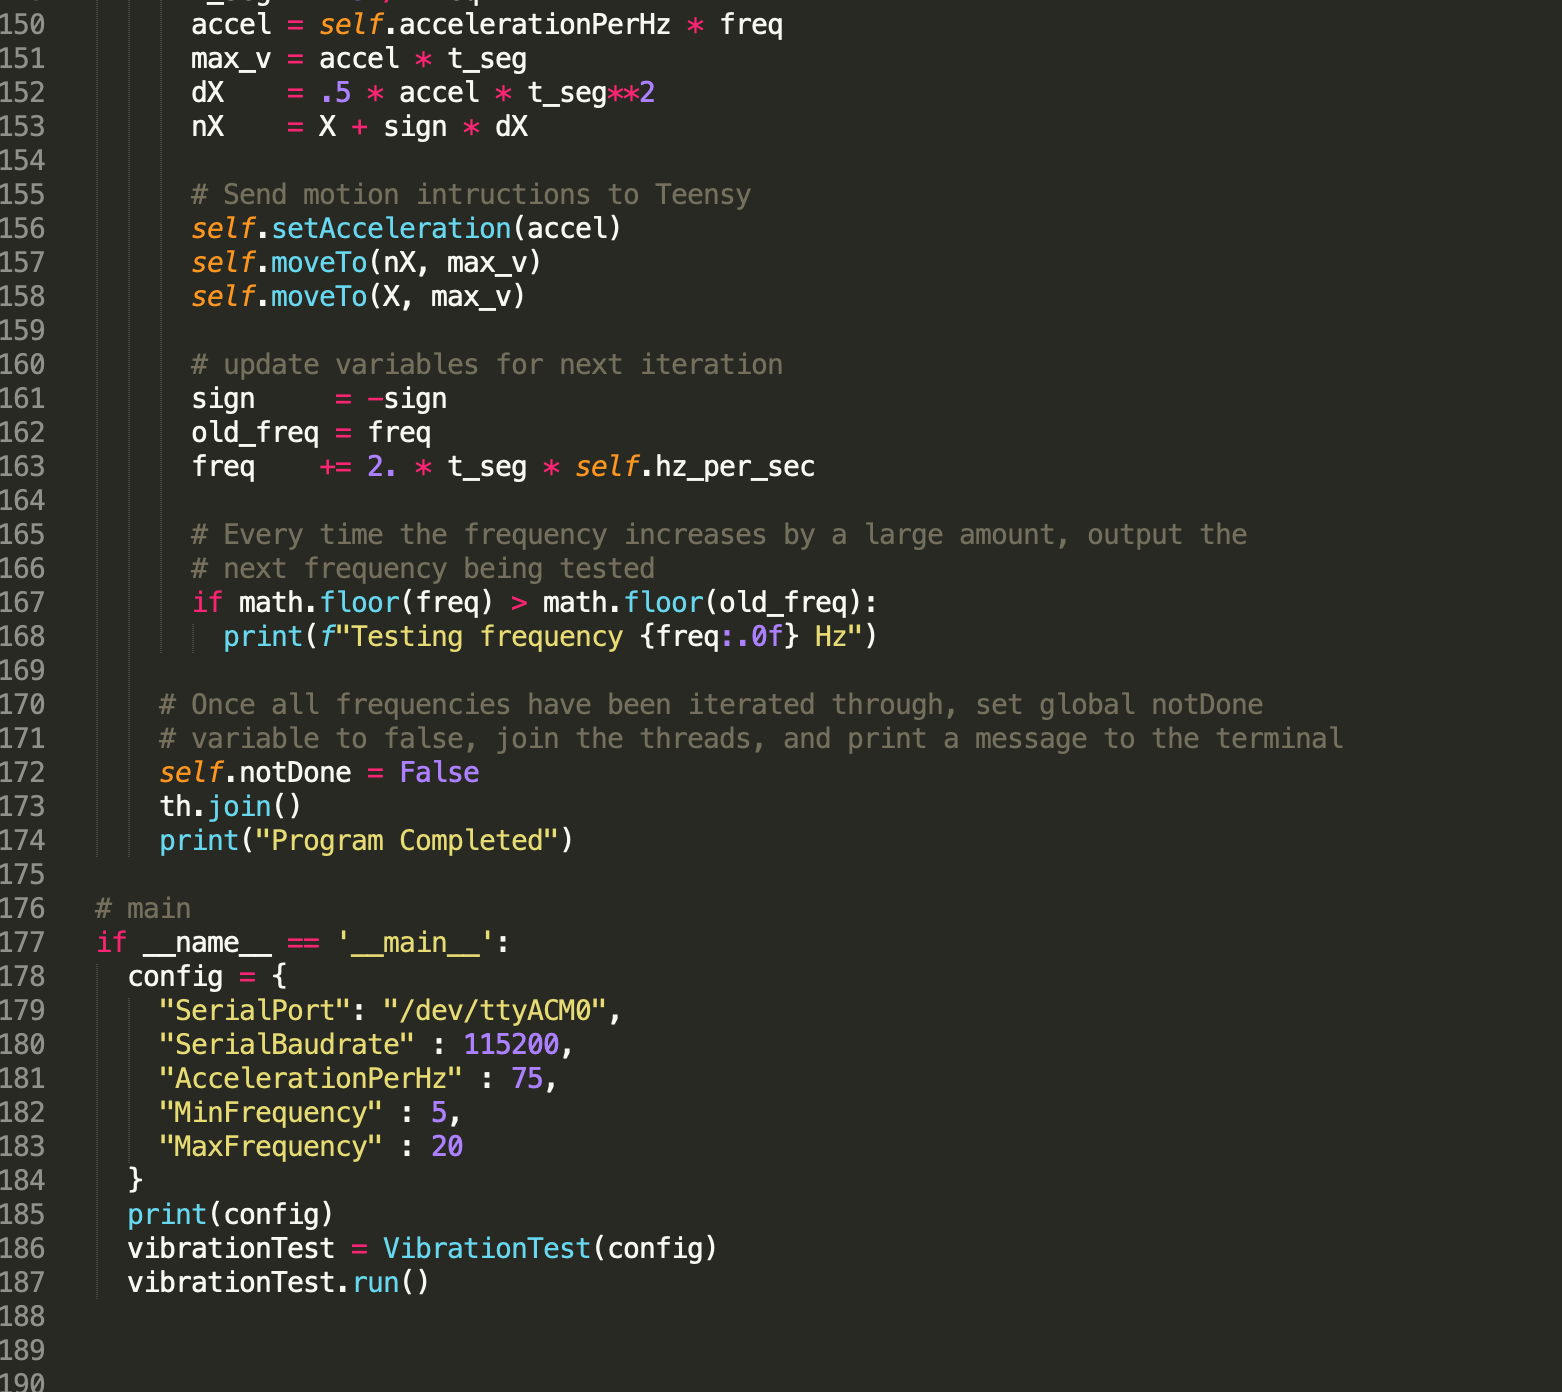
Code #2 : Resonance Tester Code
Code #3 : Arduino Motor Control Code
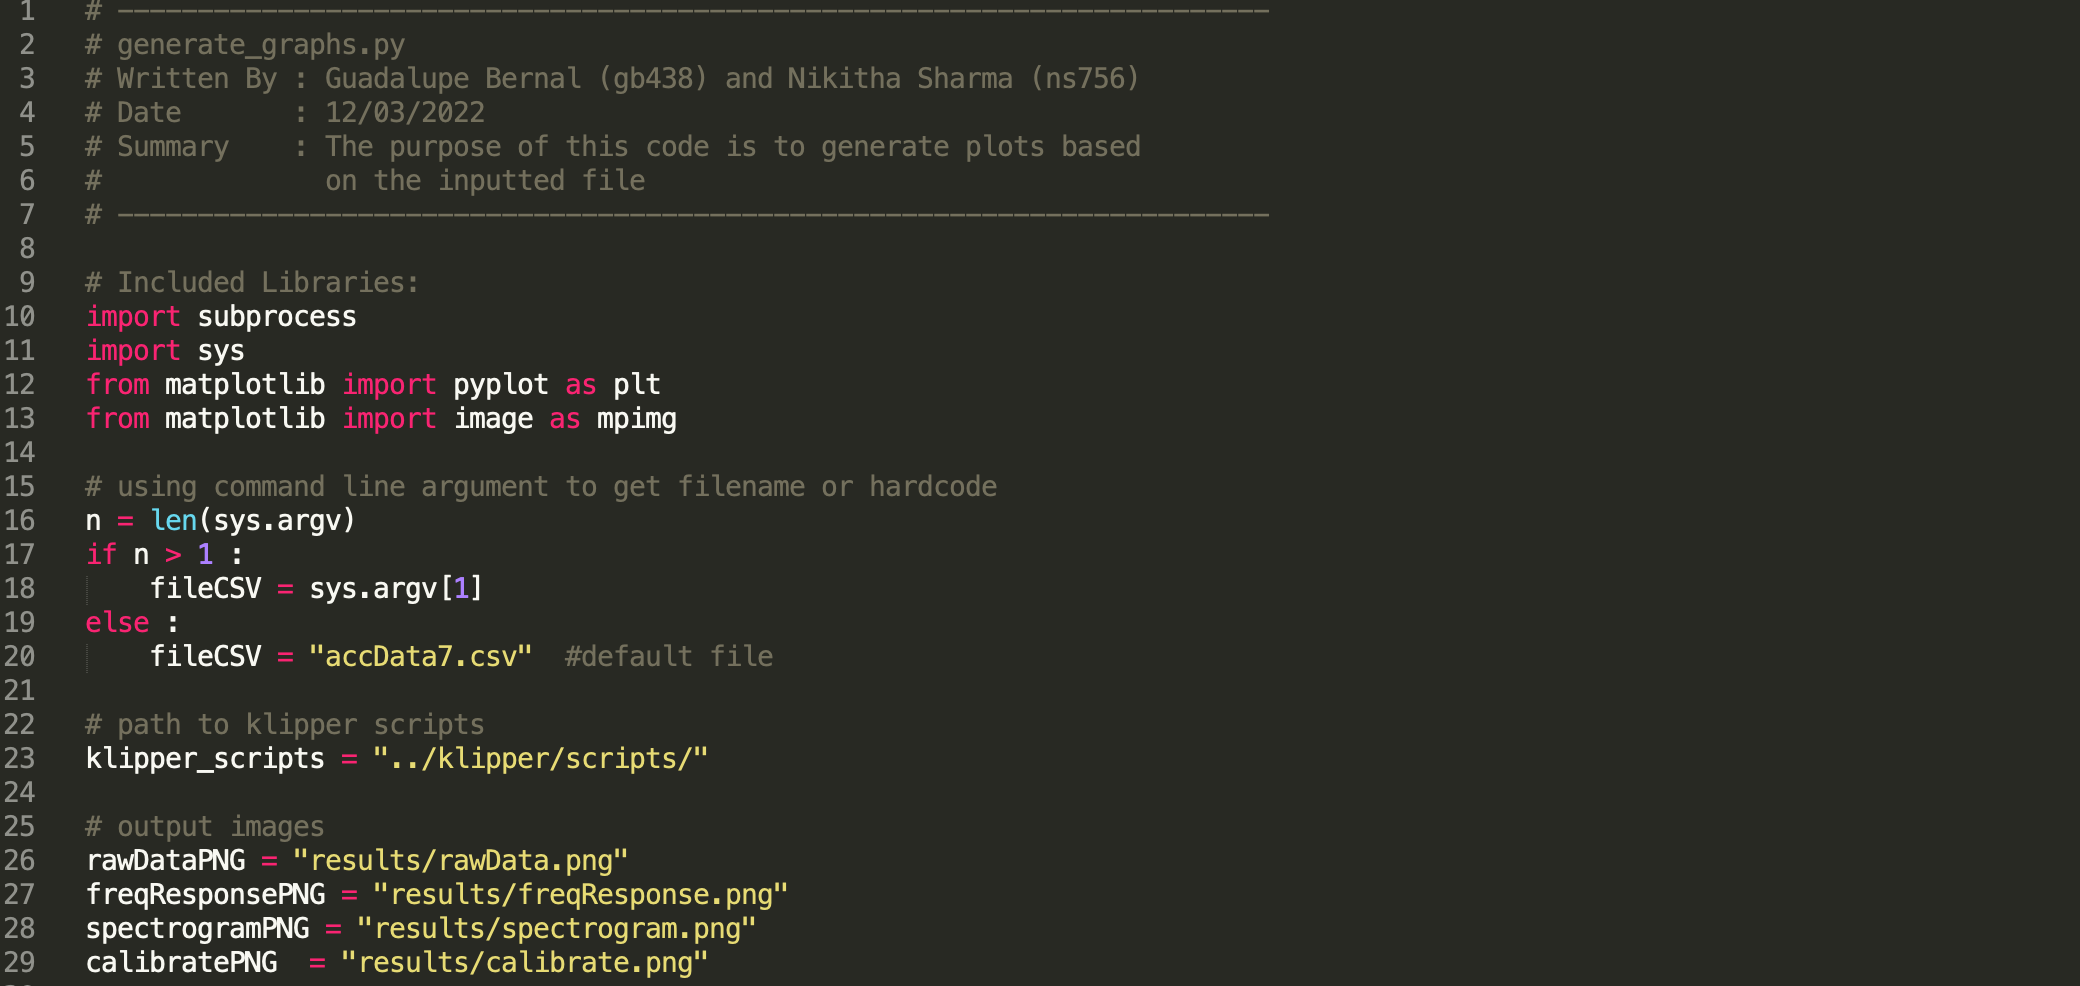
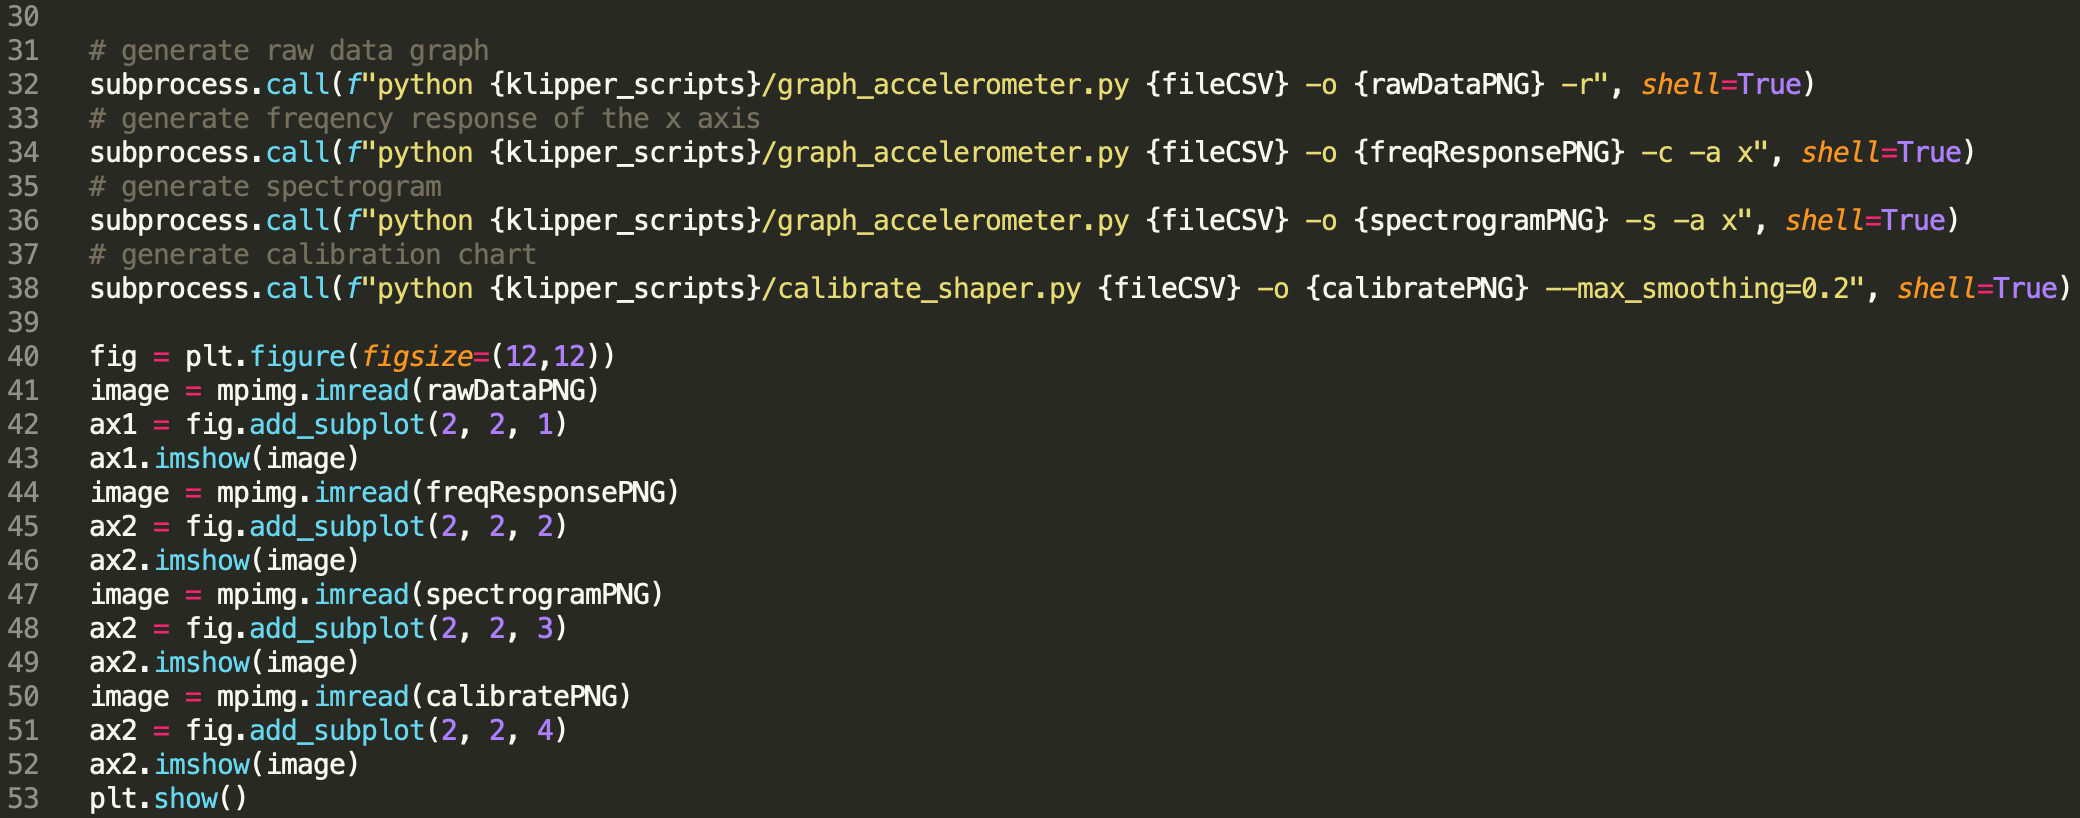
Code #4 : Figure Generator Code
Work Distribution
Team Photo!
Nikitha Sharma
ns756@cornell.edu
Designed, tested, and debugged communications between the accelerometer and the program. Coded the plot
creation using the Klipper Library. Contributed to all sections of the report.
Guadalupe Bernal
gb438@cornell.edu
Designed, tested, and debugged communications between the Raspberry PI and the Teensy Microcontroller.
Created the interface for controlling the motor from the Raspberry PI. Contributed to all sections of the
report.